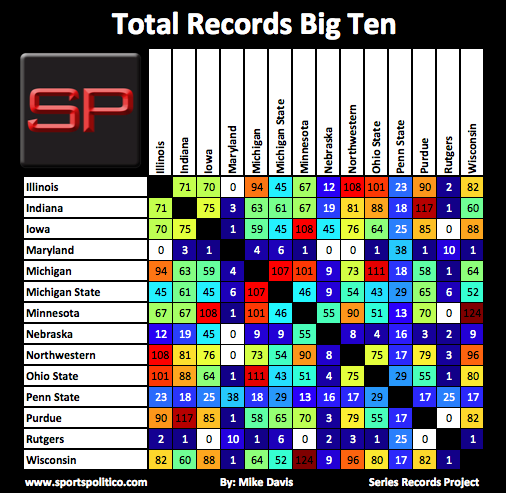
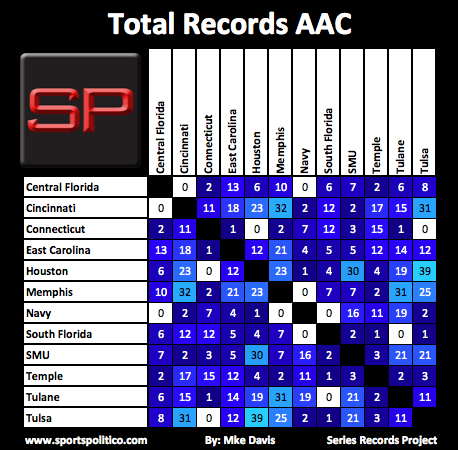
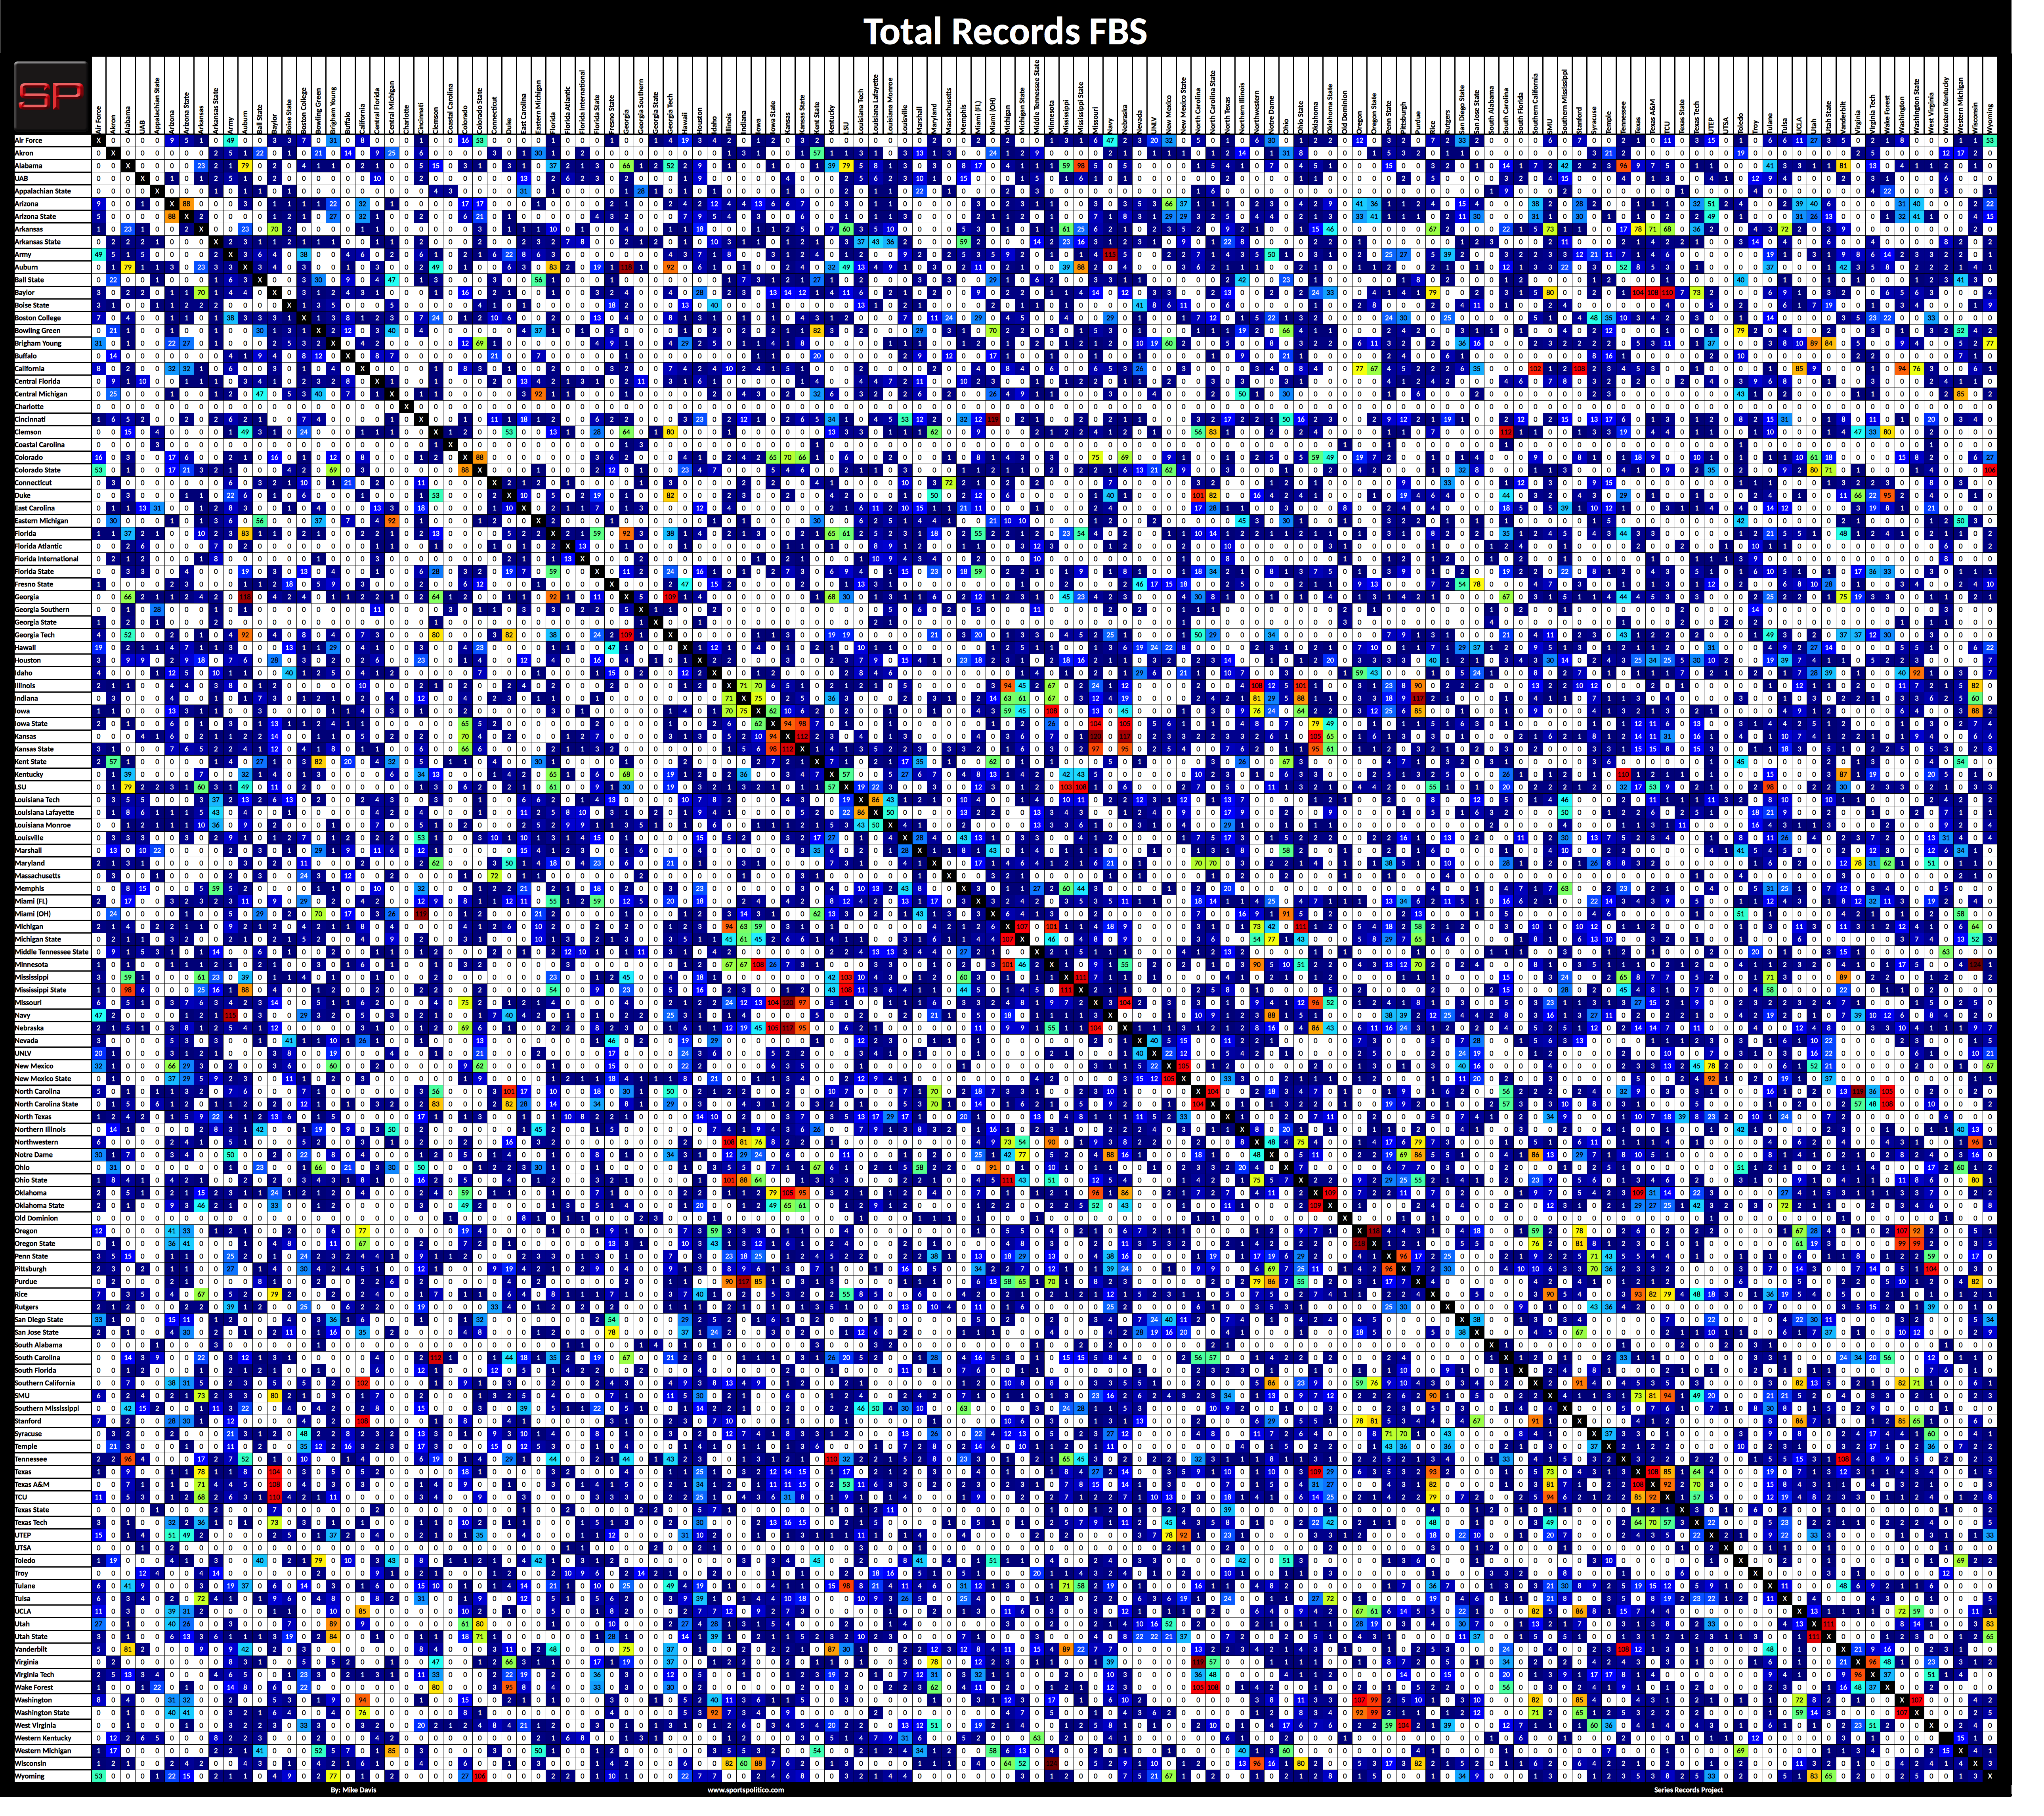
The purpose of this project is to provide a simple data table that will visualize how much history each FBS program has with their conference. I made a data table of total games played for every FBS conference. I then added a master data table of all 130 programs. With the help of my brother (who is literally a rocket scientist) we came up with a color scale algorithm, which is meant to give a heat signature based on the frequency of the games.
The algorithm is scaled on the number 124 which is the number of games that the most active FBS matchup (Minnesota-Wisconsin) has been played. The algorithm is designed to stretch out the tail ends of the scale while condensing the middle of the scale. This was done based on the logic that for institutions who have one hundred years of shared conference history, having less than 40 games is much more significant than having 60 to 85 games played. Or on the flip side, having 100+ games played is much more significant than the 70 to 90 range that most FBS schools find their most played opponent.
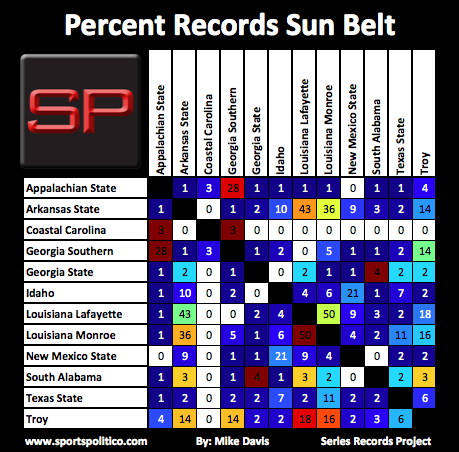
The first data table style is named “Total Records.” The entire data table is based on this 124-color scale. Every number on the 124 scale has a different color. It compares the history of every FBS series to that of Minnesota-Wisconsin. The second data style is named “Percent Records.” Using the same principles and increments as the 124 color scale, I created color scales based on the most played opponent for every FBS program.
For example the most played opponent of Arizona and Arizona State is each other at 88 games. Both programs have a color scale based on 88 games. Whereas UMASS has their most played FBS opponent at 12 games, they have a color scale based on 12. The data on this second table style compares every opponent a team has ever played to their most commonly played opponent.
The Total Records data scale has each side of the diagonal line perfectly mirroring each other. This is not the case with the Percent Records data scale. The color scale for any given entry is tailored to the program on the X axis.
The data does not include 2015-2016 results. It also includes matchups that were played when one or both programs were FCS. Vacated games are counted, however due to an error on my part in the data entry stage vacated games may be inconsistently applied. Below are the results and the images become full size when clicked on.


Follow @sportspolitico
Send us an Email: sportspolitico@gmail.com
© sportspolitico™ January 13, 2016
Like what you see? Check out more sportspolitico™ articles below.
